
No products in the cart.
Uncategorized
Top 50+ Social Media Statistics 2024: A Complete Guide
22
Dec
Dec
Welcome to 2024, where the pulse of social media beats faster than ever!
Staying ahead in the digital game means knowing the latest stats and trends.
That’s where our guide comes in! We’ve gathered all the essential 2024 social media insights, perfect for marketers and strategists looking to sharpen their plans.
Dive in to discover the key numbers and trends that will shape your strategies this year.
Global Social Media Statistics in 2024
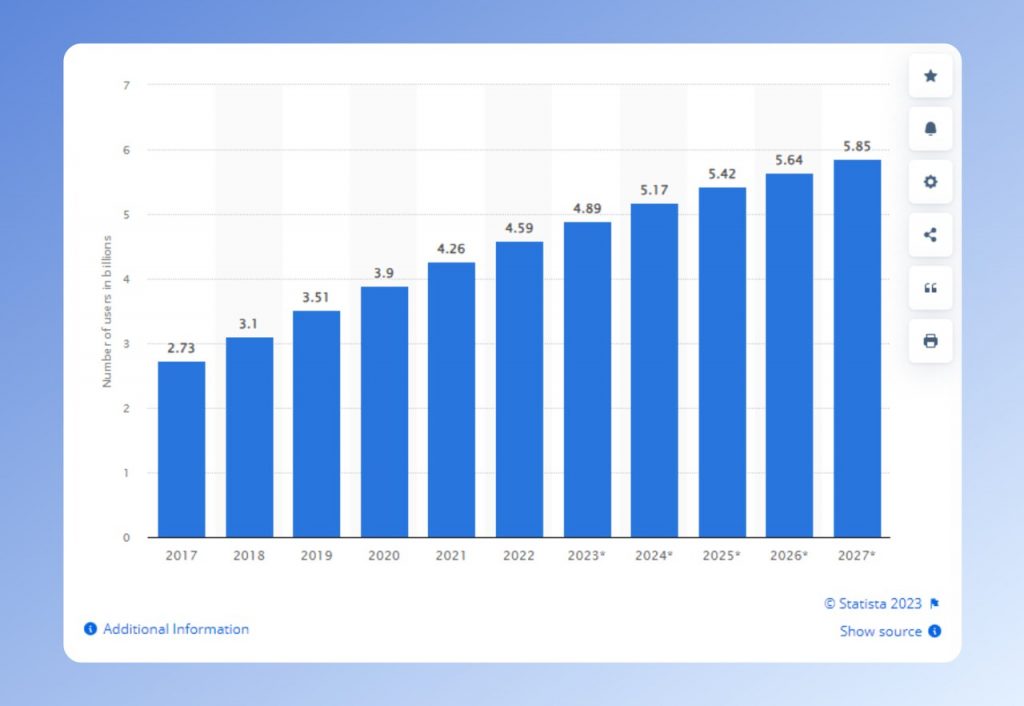
➤ Active Users: The number of active social media users has risen to over 5.7 billion in 2024, a significant increase from 4.89 billion in 2023. This means more than 60% of the world’s total population is active on social media!
➤ Mobile Daily Usage: On average, individuals spend 2 hours and 22 minutes per day on social media platforms, slightly up from 2 hours and 21 minutes in 2023.
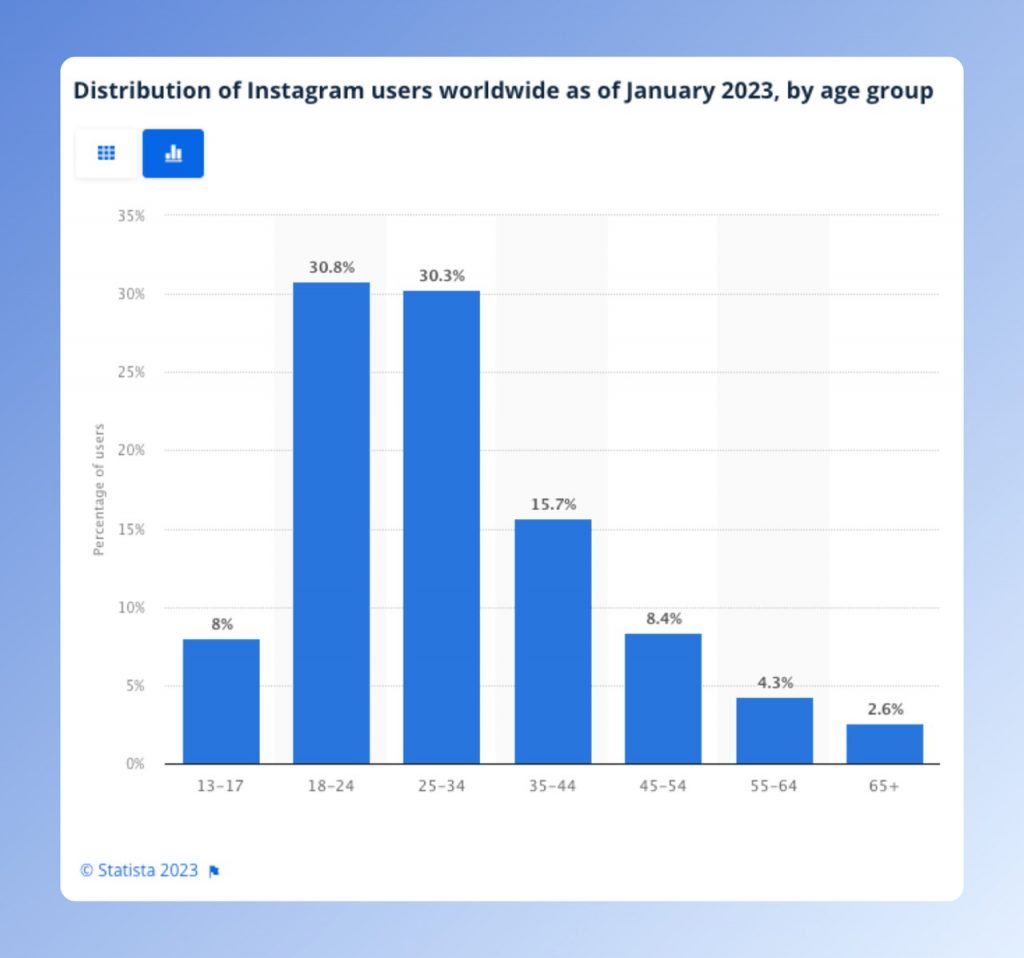
➤ Age Group: 82% of social media users fall between the ages of 18 and 34, indicating a young, dynamic audience.
➤ Gender Distribution: Women are marginally more active on social media than men and are most likely to make purchases based on influencer content.
➤ Global Usage: Social media usage is higher in developed countries compared to developing ones.
➤ Interaction Rates: Users, on average, like or comment on 5.1 posts daily in 2024, up from 4.7 in 2023.
➤ Sharing Behavior: There’s an increase in sharing behavior, with 2.2 posts shared per day in 2024, compared to 1.9 in 2023.
➤ Popular Platforms: Facebook, Instagram, and TikTok lead in terms of engagement.
Here is a table of the average engagement rates for the top 10 social media platforms in 2024:
| Platform | Average Engagement Rate |
| 0.63% | |
| 0.75% | |
| TikTok | 2.5% |
| YouTube | 0.42% |
| 0.27% | |
| 0.32% | |
| 0.20% | |
| Snapchat | 0.22% |
| 0.12% |
Social Media Ads & Marketing Statistics in 2024
➤ As of August 2023, Facebook was the leading social network for shopping in the U.S., used by 20.6% of digital shoppers. Instagram and YouTube followed with 11.8% and 10.7% of shoppers, respectively.
➤ In 2023, U.S. social commerce sales were around $64.8 billion and are projected to near $150 billion by 2028.
➤ TikTok has over 800,000 daily advertisers. This means that there is a lot of competition for attention, but it also means that there is a lot of opportunity to get your message seen.
➤ In 2023, TikTok Ads reach 1 billion people per day with over 70% conversion rate by taking action, such as visiting a website or making a purchase.
➤ According to Statista, social commerce sales could reach $8.5 trillion U.S. dollars by 2030.
➤ In 2022, Facebook generated $114 billion U.S. dollars in advertising revenue. This revenue figure is projected to grow, exceeding $127 billion U.S. dollars by 2027.
➤ Facebook accounts for about 19 percent of the global advertising revenue.
TikTok Statistics & Trends in 2024
In 2024, TikTok’s global influence continues to shape the digital world, making its trends and statistics essential knowledge for digital strategists.
➤ Global Reach: 23% of the 5.3 billion internet users worldwide are active on TikTok.
➤ Social Media Presence: TikTok holds a 24.65% share among the 4.95 billion active social media users.
➤ User Engagement: In 2023, users spent an average of 52 minutes per day on TikTok.
➤ Top Countries: TikTok’s top countries by user count are China, India, the U.S., Brazil, and Indonesia.
➤ Approximately 1.211 billion TikTokers are active in the United States on a monthly basis, according to Statista.
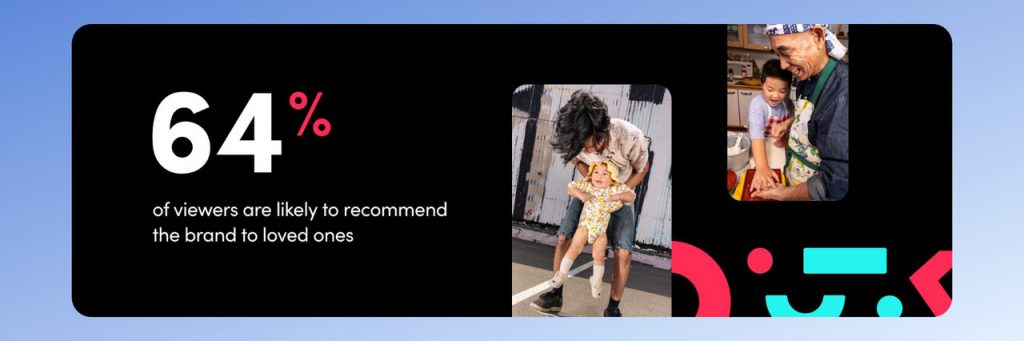
➤ TikTok users are 55% more likely to promote brands than those on other platforms.
➤ The platform ranks #1 globally for ad equity: it’s the preferred ad environment for both brands and consumers.
➤ TikTokers are 1.8 times more likely to influence their personal networks to purchase endorsed products.
➤TikTokers are 20% more likely to purchase after watching a brand’s video on TikTok.
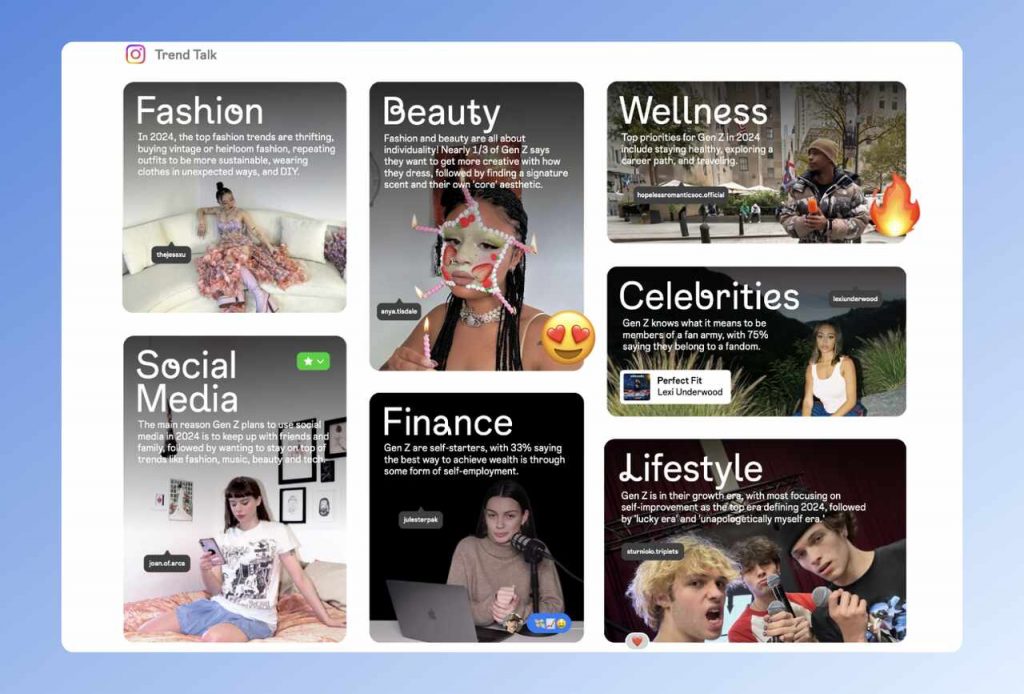
2023 saw several viral trends on TikTok that created significant buzz. From dance challenges to unique content creation styles, these trends not only entertained but also influenced consumer behaviors and brand interactions.
In 2023 TikTok was the most popular social media app among Gen Z.
By tapping into TikTok’s diverse user base, brands have a unique opportunity for targeted marketing and content localization.
The platform’s ability to influence consumer behavior and brand engagement, especially through visual and interactive content, makes it a significant player in the social media landscape.
You too can leverage this expansive platform to elevate your brand. Learn about how much TikTokers earn, check out TikTok’s Creator Program and unlock new revenue opportunities.
Want to Increase Your TikTok Views?
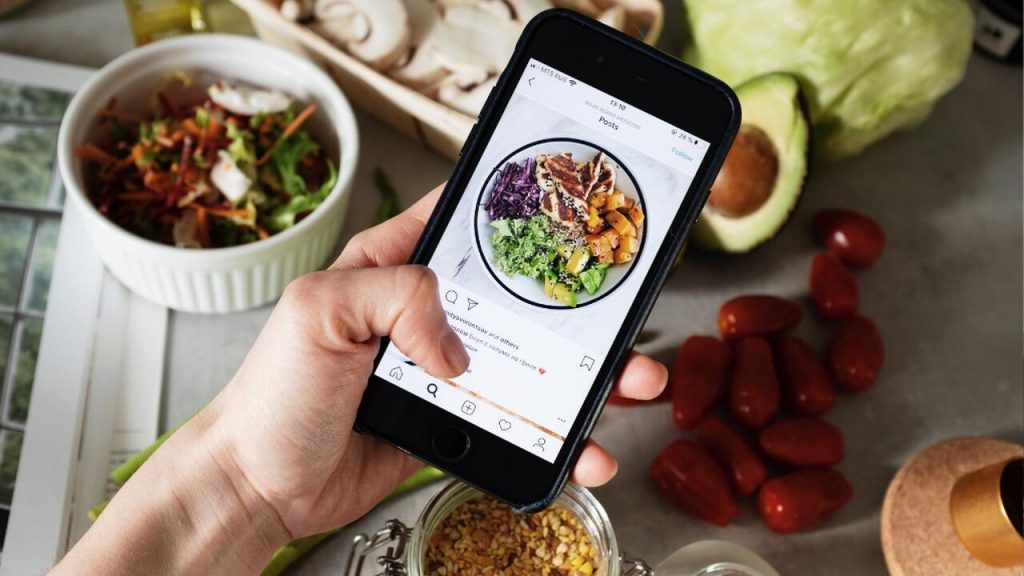
Instagram Statistics & Trends in 2024
Instagram has undergone significant updates and changes, shaping it into a dynamic platform with wide-reaching impacts.
Here we’ve gathered all the important information to take a closer look at these key developments:
➤ Over 2 Billion Active Instagram Users: Instagram boasts a massive user base, making it one of the world’s most popular social media platforms.
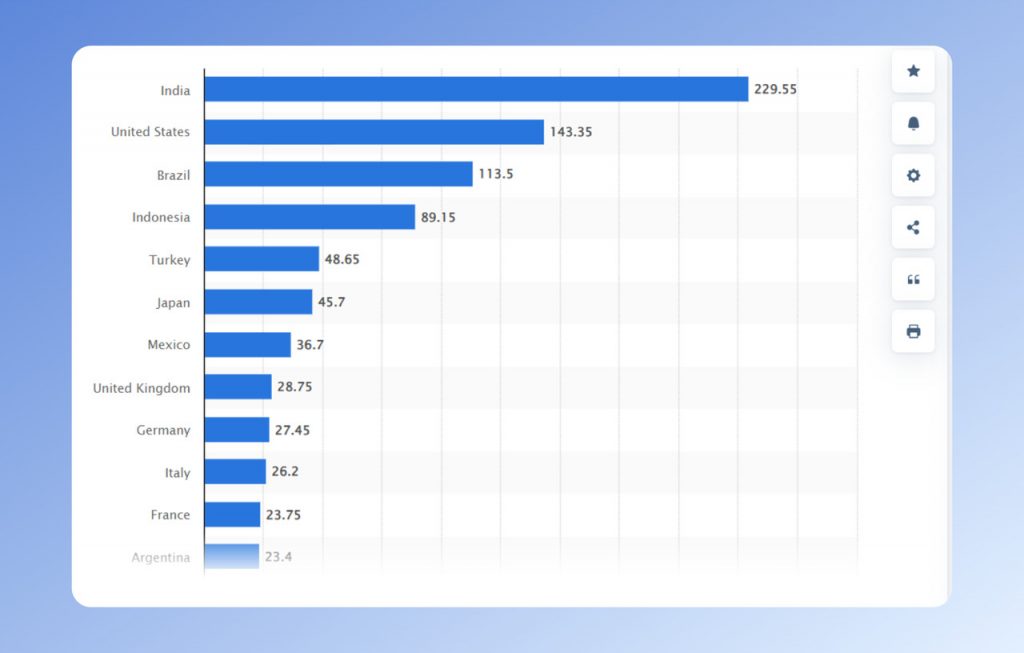
➤ India’s Leading Position: As of January 2023, India leads with the largest Instagram audience globally, boasting 229 million users.
➤ Following India, the United States has 143 million users, and Brazil has 113 million.
➤ Other Top Countries: Indonesia, Turkey, and Japan are in the fourth, fifth, and sixth positions in terms of user numbers.
➤ High Penetration Rates: Brunei has the highest Instagram audience reach, with 92% of its population using the service. Guam and the Cayman Islands follow with penetration rates of 79.2% and 78.8%, respectively, ahead of Kazakhstan, Iceland, and Montenegro.
➤ Rapid Growth Timeline: Instagram took 11.2 years to reach 2 billion monthly active users. In comparison, WhatsApp (also owned by Meta) took 11 years, Facebook 13.3 years, and YouTube just over 14 years.
➤ According to Statista as of May 2021, Instagram was the fourth most visited social media service in the U.S., following Facebook, Pinterest, and Twitter.
➤ Among TikTok, Instagram, and Snapchat, TikTok was the most used platform by Generation Z.
➤ Instagram’s usage among Gen Z declined to 57% in 2021, from 61% in 2020 and 64% in 2019.
➤ The app is most popular among the 25 to 34-year-old age group, which constituted about a third of all U.S. users as of December 2021.
➤ Gender Usage Trends: Instagram tends to be more frequently used by women.
➤ 100 Million+ Businesses on Instagram: The platform is utilized by over 100 million businesses for targeting audiences and promoting products and services.
➤ 50% Instagram Users Follow a Business: Half of Instagram’s users follow at least one business, indicating a large potential audience for companies.
➤ 75% Instagram Users Made Purchases Post-Ad: A significant 75% of users have made purchases after seeing ads, highlighting the platform’s effectiveness in driving conversions.
➤ 60% Prefer Buying from Brands They Follow on Instagram: A majority of users are more inclined to purchase from brands they follow, underscoring the importance of building strong follower relationships.
➤ 45% Purchased Through Instagram Influencers: Nearly half of the users report making purchases influenced by Instagram influencers, demonstrating the power of influencer marketing.
In essence, Instagram’s evolving landscape shows its immense influence in connecting businesses, influencers, and consumers in a dynamic digital marketplace.
YouTube Statistics & Trends in 2024
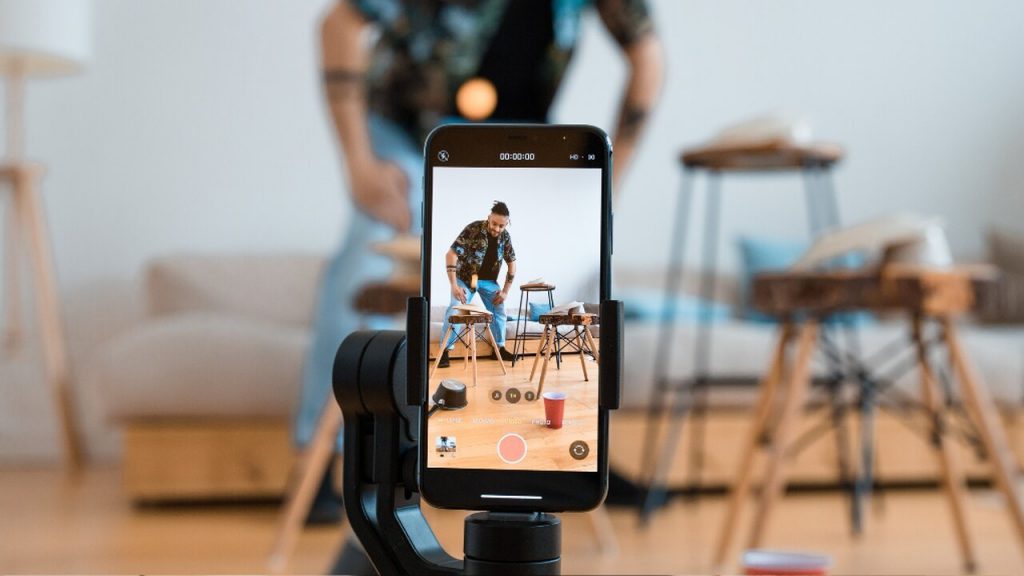
YouTube isn’t just a place to watch videos; it’s a goldmine for those wondering how to monetize a YouTube channel and make the most of their creative content.
This platform keeps changing and growing, making it super important for video creators and businesses to keep up with the latest trends, especially if they want to earn some cash.
Let’s break down what’s new and nifty on YouTube, especially focusing on the cool ways these updates can help you make money:
➤ YouTube’s 2.91 billion monthly active users make it the world’s second most visited site after Google.
➤ Users typically spend 1 hour and 24 minutes daily on YouTube, more than on any other social platform.
➤ Mobile devices account for 73% of YouTube’s watch time, reflecting a trend towards mobile consumption.
➤ Video creators earn an average $18 per 1,000 views, though this can vary widely by niche and strategy.
➤MrBeast has more than 16 million subscribers and his videos have been viewed over 10 billion times. In 2023, Forbes estimated that MrBeast earned $54 million from YouTube.
➤ Over 1 billion hours of live streaming content were watched on YouTube in Q1 2023.
➤ Exclusive content on YouTube Originals has garnered over 15 billion views.
➤ More than 75% of small businesses use YouTube for marketing purposes.
➤ YouTube ads offer a cost-effective reach, with some ads costing as little as $0.01 per view.
➤ In Q3 of 2023, YouTube’s global advertising revenue reached $7.95 billion, a 12% increase from Q3 of 2022.
➤ YouTube stands as one of the largest online video platforms globally.
➤The most popular YouTube channels have garnered over 100 million subscribers.
➤ YouTube is a hub for customer feedback through comments and ratings.
Customer Relationship Building: Businesses and creators can foster relationships with audiences through channel subscriptions and interactions. YouTube serves as a powerful tool for marketing and increasing brand awareness.
YouTube’s trends, particularly in monetization, demonstrate its vital role as a modern digital platform for content creators and businesses, offering diverse ways to engage with a global audience and monetize content effectively.
General Social Media Key Statistics & Insights 2024
As of 2024, platforms like Twitter and its contemporaries continue to dominate the digital landscape, each with unique user statistics and engagement patterns.
Let’s delve into the latest figures to understand better how these platforms are performing and what makes each of them distinct in the crowded social media space:
➤ Facebook dominates with 2.91 billion monthly active users, maintaining its position as the most used social platform.
➤ LinkedIn with 810 million monthly active users, it stands as a leading professional networking platform.

➤ Snapchat attracts 538 million monthly active users, popular especially among younger demographics.
➤ WeChat commands a massive user base of 1.26 billion, predominantly in China but with growing international use.
➤ WhatsApp enjoys widespread popularity with 2 billion monthly active users, emphasizing its role as a primary communication tool globally.
These statistics not only demonstrate the vast scale and variety of these platforms but also highlight the unique niches they occupy in the digital social landscape.
Each platform, from Twitter’s real-time conversation space to Facebook’s extensive network, plays a distinct role in shaping today’s online social interactions.
Leverage Social Media Growth Services in 2024
In 2024, growing your social media presence quickly and efficiently is key, and that’s where Amedia Social’s services shine.
Imagine giving your Instagram and YouTube channels a turbo boost with a surge of new followers and views. With Amedia Social, you can purchase real Instagram followers & YouTube views, help your reels go viral or even earn money with YouTube monetization.
Ready to elevate your online presence? Take the fast lane to growth and discover what Amedia Social can do for you.
Start Growing with Amedia Social
Frequently Asked Questions

How many people are using social media in 2024?
The number of active social media users has surged to over 5.7 billion in 2024, a significant jump from 4.89 billion in 2023. This accounts for more than 60% of the global population!
What’s the average daily time spent on social media now?
On average, people are spending about 2 hours and 22 minutes each day on social media platforms, slightly more than the 2 hours and 21 minutes in 2023.
What is the most popular social media platform?
Facebook leads the pack with 2.91 billion monthly active users, making it the most used social platform as of now.
What social media platform is popular among Gen Z?
Tiktok with 1.211 billion TikTokers in the US, and snapchat with 538 million monthly active users, are the popular platforms among Gen Z, offering unique, ephemeral content.
Who is more active on social media, men or women?
Women are marginally more active than men on social media and are more influenced by content creators for making purchases.
How does social media affect mental health statistics?
Social media’s impact on mental health has been a subject of increasing concern and study. Here are some key statistics and findings from 2023:
Self-Harm and Suicide: While suicide rates among teens and young adults are rising, a direct link between social media use and suicide hasn’t been definitively proven.
However, social media does play a role in how youth seeking social support may encounter negative messaging that could promote self-harm.
Anxiety: Anxiety is the most prevalent mental health disorder among adolescents.
Social media can contribute to feelings of anxiety and lower self-esteem in teens. Studies have shown mixed results on whether the amount of time spent on social media directly increases anxiety in teens.
Depression: Depression rates have increased by 70% over the last 25 years, with factors like the pandemic and social stressors contributing. While 38% of teens feel overwhelmed by social media drama, a direct correlation between social media use and depression is still under research.
Social Media Addiction: Approximately 5-10% of Americans may meet the criteria for social media addiction. Among young people aged 18-22, 40% consider themselves somewhat addicted to social media. Excessive use of social media is linked to changes in brain chemistry related to dopamine production.
These statistics highlight the complex relationship between social media use and mental health, indicating both potential risks and areas needing further exploration.
EN/ES